
Global Carbon Markets Highlights from the Latest Report
News from Web 19-Apr-2023
Global Carbon Markets: Highlights from the Latest Report
The Hinrich Foundation is proud to release their latest data-driven report: A Visual Primer on Global Carbon Markets.
This report was produced in partnership with Visual Capitalist, and provides insights into how carbon markets work, how they’re evolving, and where they’re being effectively implemented.
Why Carbon Markets?
Climate change is viewed as one of the greatest challenges facing the world today. In response, nearly every country in the world has set a goal to reach net zero by 2050.
To do this, countries will need to find ways to reduce their reliance on fossil fuels. One solution is carbon markets, which give businesses and individuals a place to buy and sell carbon credits. Carbon credits are tradeable permits that give their holder the right to emit a set amount of CO2.
When combined with government-imposed limits on pollution, carbon credits create an economic incentive for businesses to reduce their emissions.
For example, a company that pollutes beyond local limits has two options. It can either mitigate its emissions by investing in cleaner technologies, or purchase carbon credits to stay within compliance. In the mean time, the proceeds from these credits may fund other emissions-reducing projects, such as a wind or solar farm.
Data Preview
This infographic provides a small preview of the data visualizations featured in the full report.
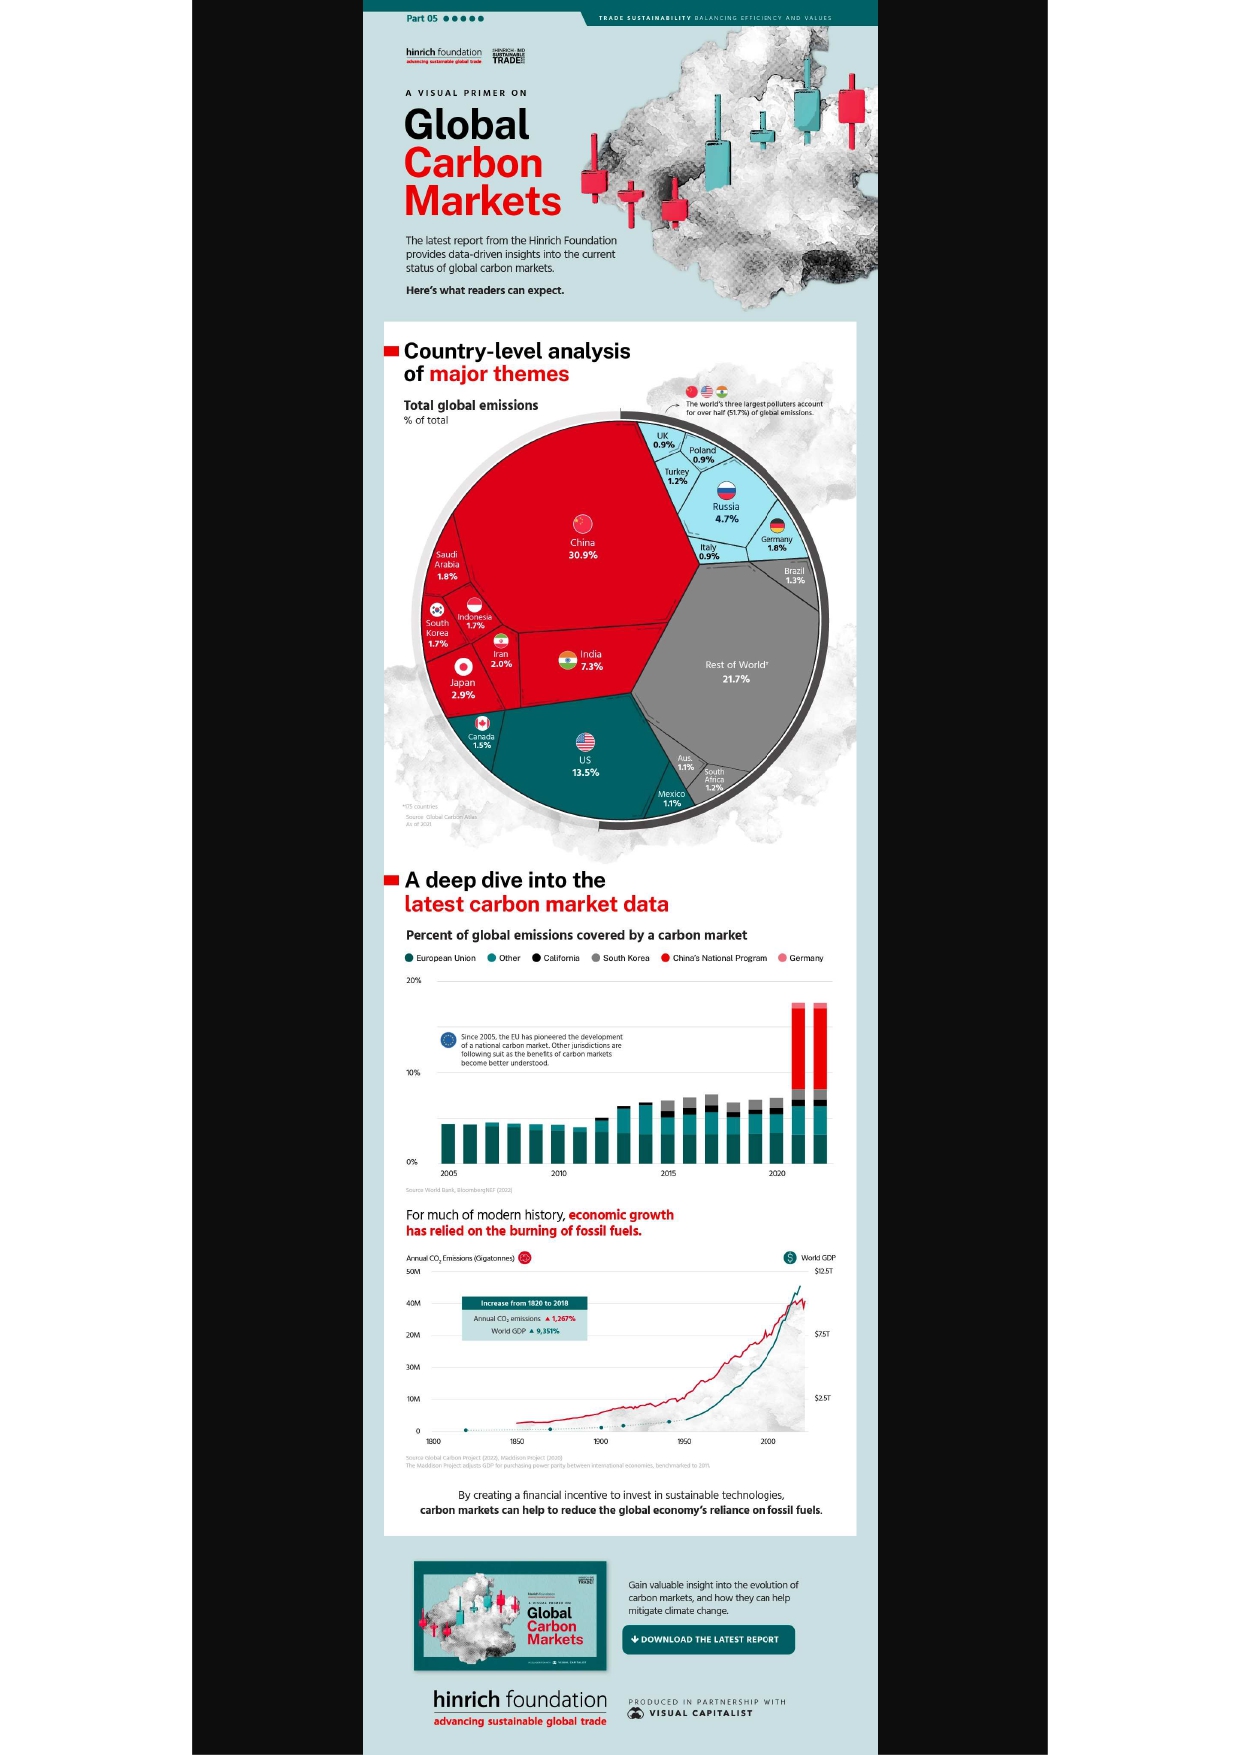
We begin by breaking down global emissions by country. A key finding is that the world’s three largest polluters account for more than half (51.7%) of total emissions.
| Country | Emissions (MtCO2) | Percentage of Total |
| China | 11472 | 0.309 |
| U.S. | 5007 | 0.135 |
| India | 2710 | 0.073 |
| Russia | 1756 | 0.047 |
| Japan | 1067 | 0.029 |
| Iran | 749 | 0.02 |
| Germany | 675 | 0.018 |
| Saudi Arabia | 672 | 0.018 |
| Indonesia | 619 | 0.017 |
| South Korea | 616 | 0.017 |
Source: Global Carbon Atlas. As of 2021
This data gives us an idea of where carbon markets could have the greatest potential. As shown in the second chart of this infographic, national carbon markets cover less than 20% of global emissions.
Download the Free Report
A Visual Primer on Global Carbon Markets is a free report from the Hinrich Foundation, produced in partnership with Visual Capitalist. Readers will gain valuable insights into the evolution of carbon markets, and how they can help mitigate climate change.

More News
Hacked By Team_CC || EXPLOITER~XED Was Here!
India’s Carbon Credit Trading Scheme (CCTS) marks a pivotal shift toward a reg...
15-Apr-2026
India’s Climate Budget 2026-27
India’s Climate Budget 2026–27 reflects a targeted approach to the energy tr...
11-Mar-2026
ESG Frameworks and Why They Matter: A Rating Provider’s Perspective
An in-depth overview of key global and regulatory ESG frameworks, explaining how...
23-Jan-2026
UK Proposes Regulation of ESG Ratings to Strengthen Market Trust
The UK proposes formal regulation of ESG rating providers to address transparenc...
15-Jan-2026
Double Materiality Assessment and its Significance
This blog explains the concept of Double Materiality Assessment and why it is be...
12-Jan-2026