
Rating Methodology
1. Intro to Rating Framework
Our team has developed an extensive database of 350+ data points under the three pillars of Environment, Social & Governance.
The company is assessed on these data points across 30 KPIs which are a mix of both industry agnostic and industry specific KPIs.
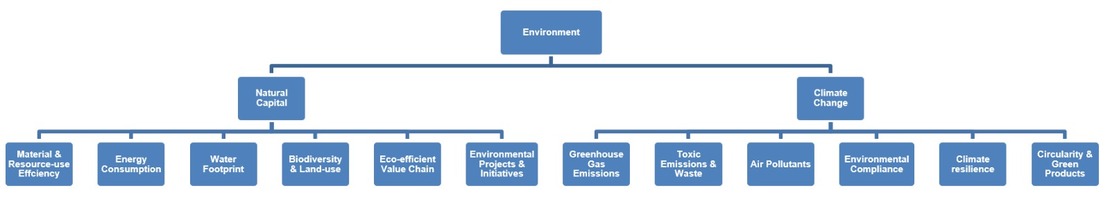
Chart 1: Environment pillar
In Chart 1, the Environment pillar is assessed across two themes: Natural Capital (material and resource-use efficiency, energy consumption, water footprint, eco-efficient value chain, and environmental projects and initiatives) and Climate Change (greenhouse gas emissions, toxic emissions and waste, air pollutants, environmental compliance, climate resilience and circularity and green products). Together, these capture the overall environmental impact.
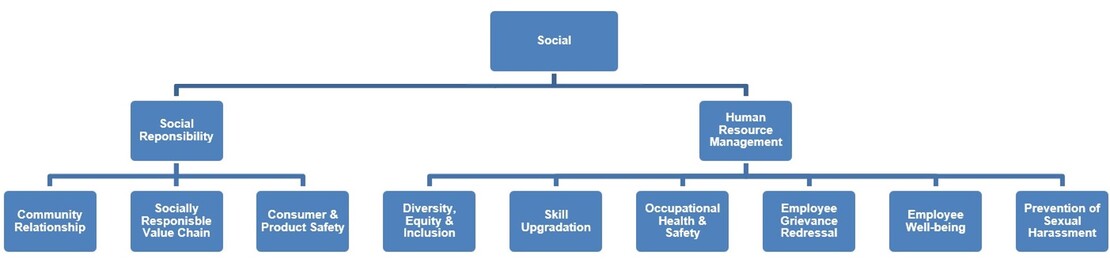
Chart 2: Social pillar
The Social pillar is assessed across two themes: Social Responsibility (community relationships, socially responsible value chains, and consumer and product safety) and Human Resource Management (diversity, equity and inclusion, skills upgradation, occupational health and safety, employee grievance redressal, employee well-being and prevention of sexual harassment). Together, these themes reflect social impact and workforce practices.
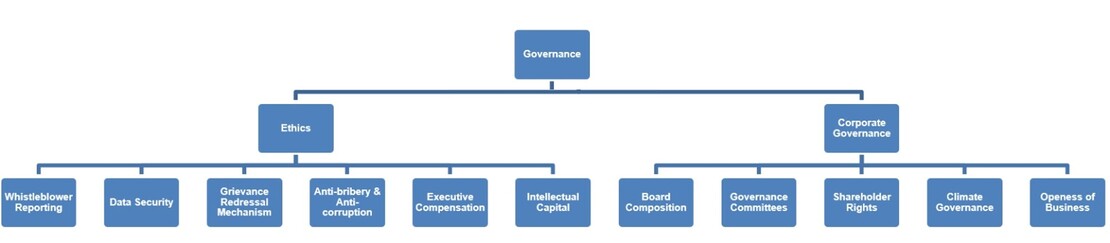
Chart 3: Governance pillar
The Governance pillar is assessed across two themes: Ethics (whistle-blower reporting, data security, governance redressal mechanisms, anti-corruption, executive compensation and intellectual capital) and Corporate Governance (board composition, governance committees, shareholder rights, climate governance and openness of business). These themes reflect organizational integrity, accountability and strong governance practices.
The ratee company is compared with its top five peers as per market capitalisation based on the SEBI industry classification.
2. Score Mapping
All the ESG Ratings provided by us on a scale of 0-100, where a higher score signifies a better ESG performance.
Pillar scores across the Environmental and Social Pillars are calculated based on the weighted average of Key Factor Scores under each respective pillar. The weights are assigned to Key Factors based on the materiality matrix developed by us after a thorough research.
| Final Rating | Comparable Grading by ERPs abroad |
Leader/Laggard |
|---|---|---|
| 85.71 – 100 | A++ | Leader |
| 71.43 – 85.70 | A+ | Excellent |
| 57.14 – 71.42 | A | Good |
| 42.86 – 57.13 | B++ | Above Average |
| 28.57 – 42.85 | B+ | Average |
| 14.29 – 28.56 | B | Below Average |
| 0.00 – 14.28 | C | Laggard |
3. Industry Classification
SEBI has developed a harmonized four level industry classification framework for the purpose of credit rating and peer benchmarking. SEBI has classified all businesses into 22 sectors and split the sectors into 200 basic industries. We have adopted the same framework for the purpose of ESG Rating as well. You are compared with the top five companies as per market capitalization within the same basic industry. This enables a more standardized and uniform comparison.
View the industry classification
4. Weights
We have conducted comprehensive research to identify material topics for each industry, and have accordingly created a materiality matrix which is used to determine weights for each Key Factor. The weights are distributed for all 200 basic industries on the basis of how material the topic is to the industry. For example – data security holds the most weightage for the Banking industry, while greenhouse gas emissions hold the most weightage for Iron & Steel industry.